Data Scientist (Retention and Growth Analytics)
Churn Modeling, Experimentation, Decision Thresholding
Python, SQL, Tableau/Power BI, Machine Learning
Hi, I’m Bonifasius Sinurat, a Data Scientist who builds end-to-end machine learning solutions with clear decision logic.
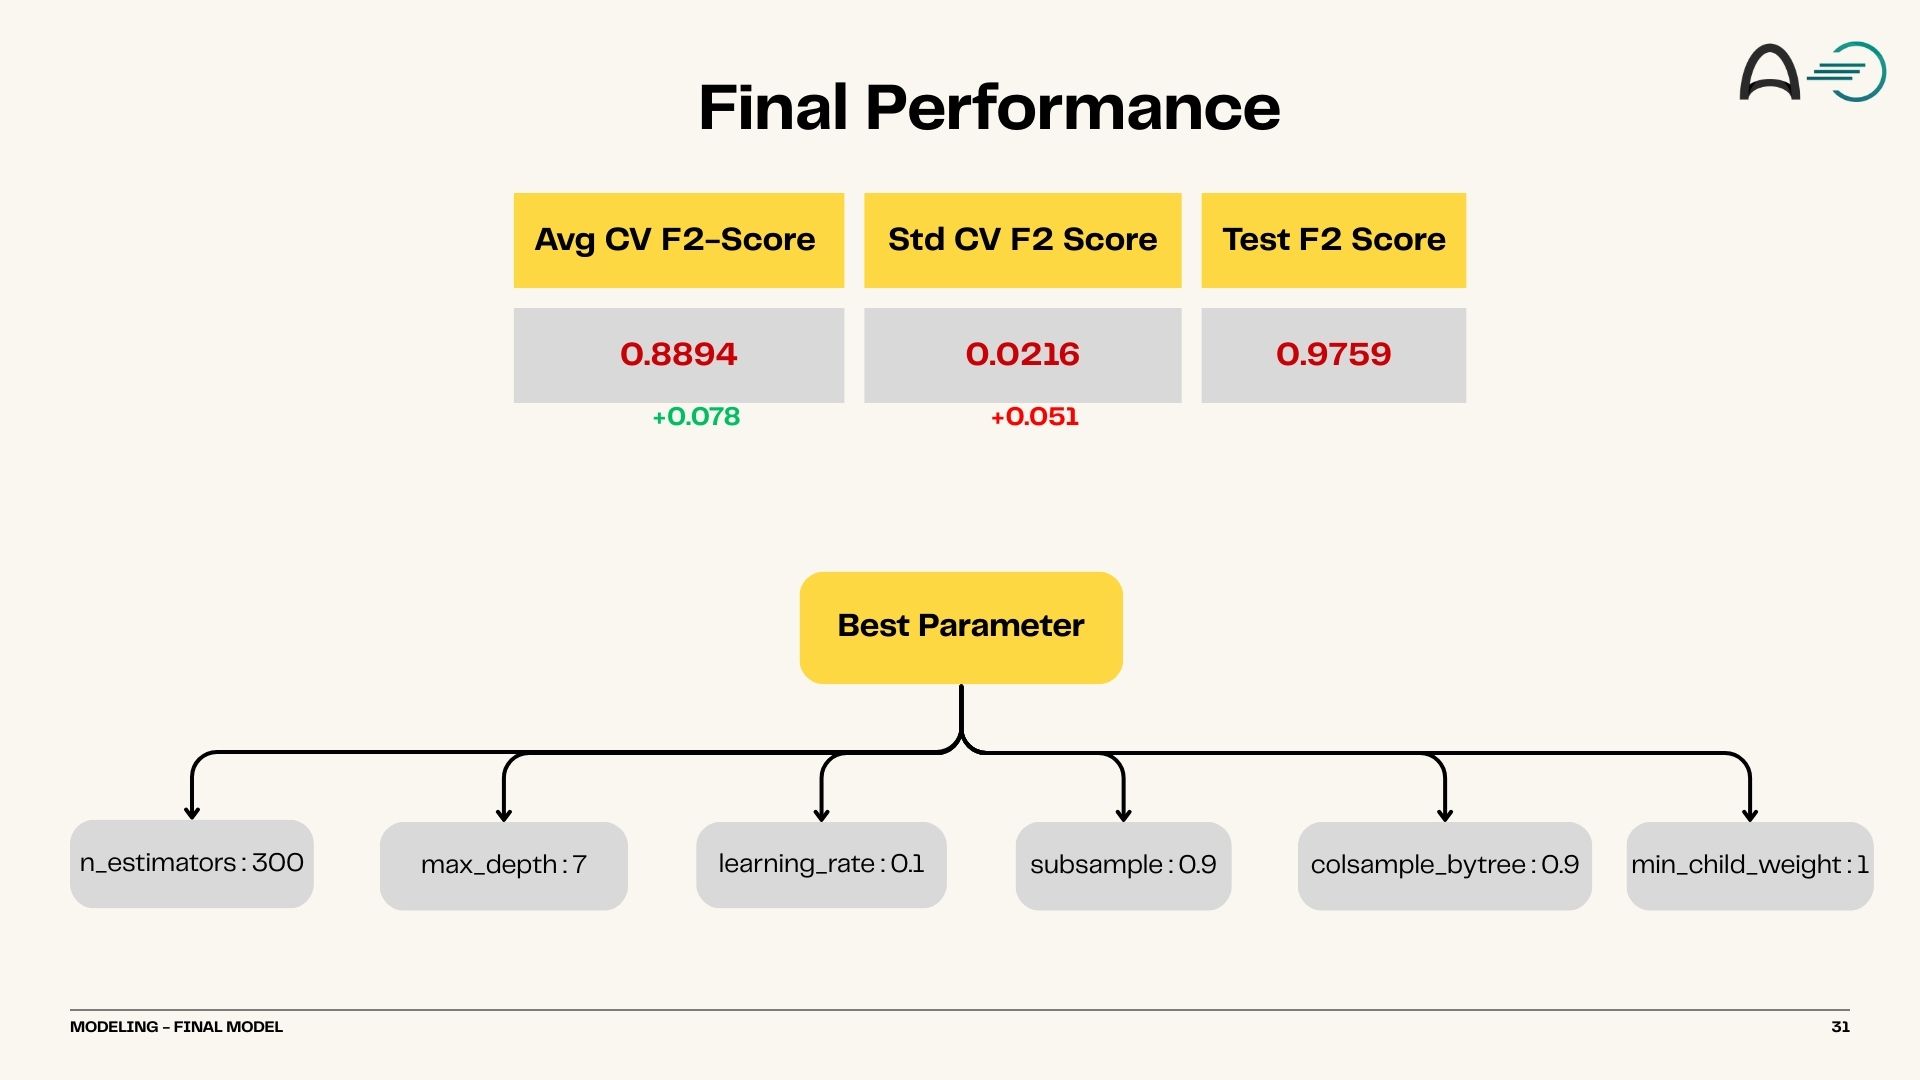
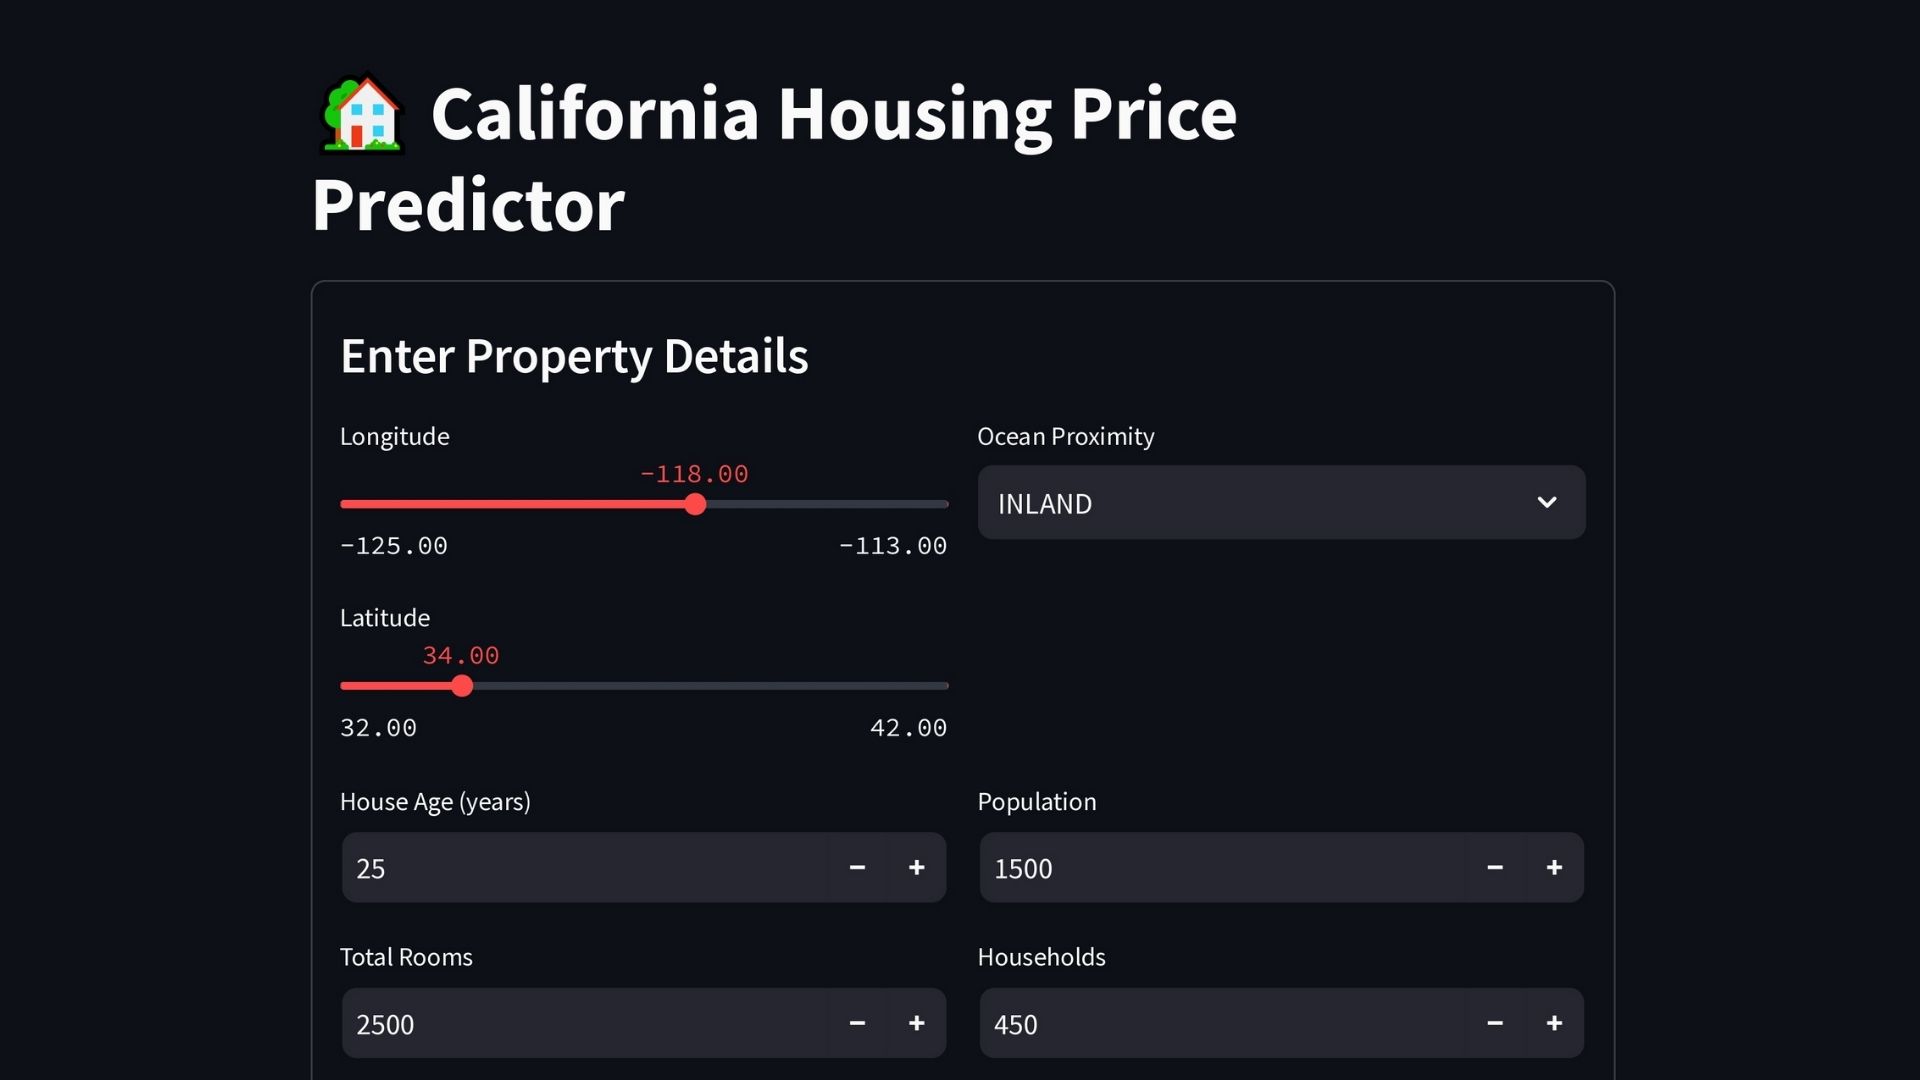
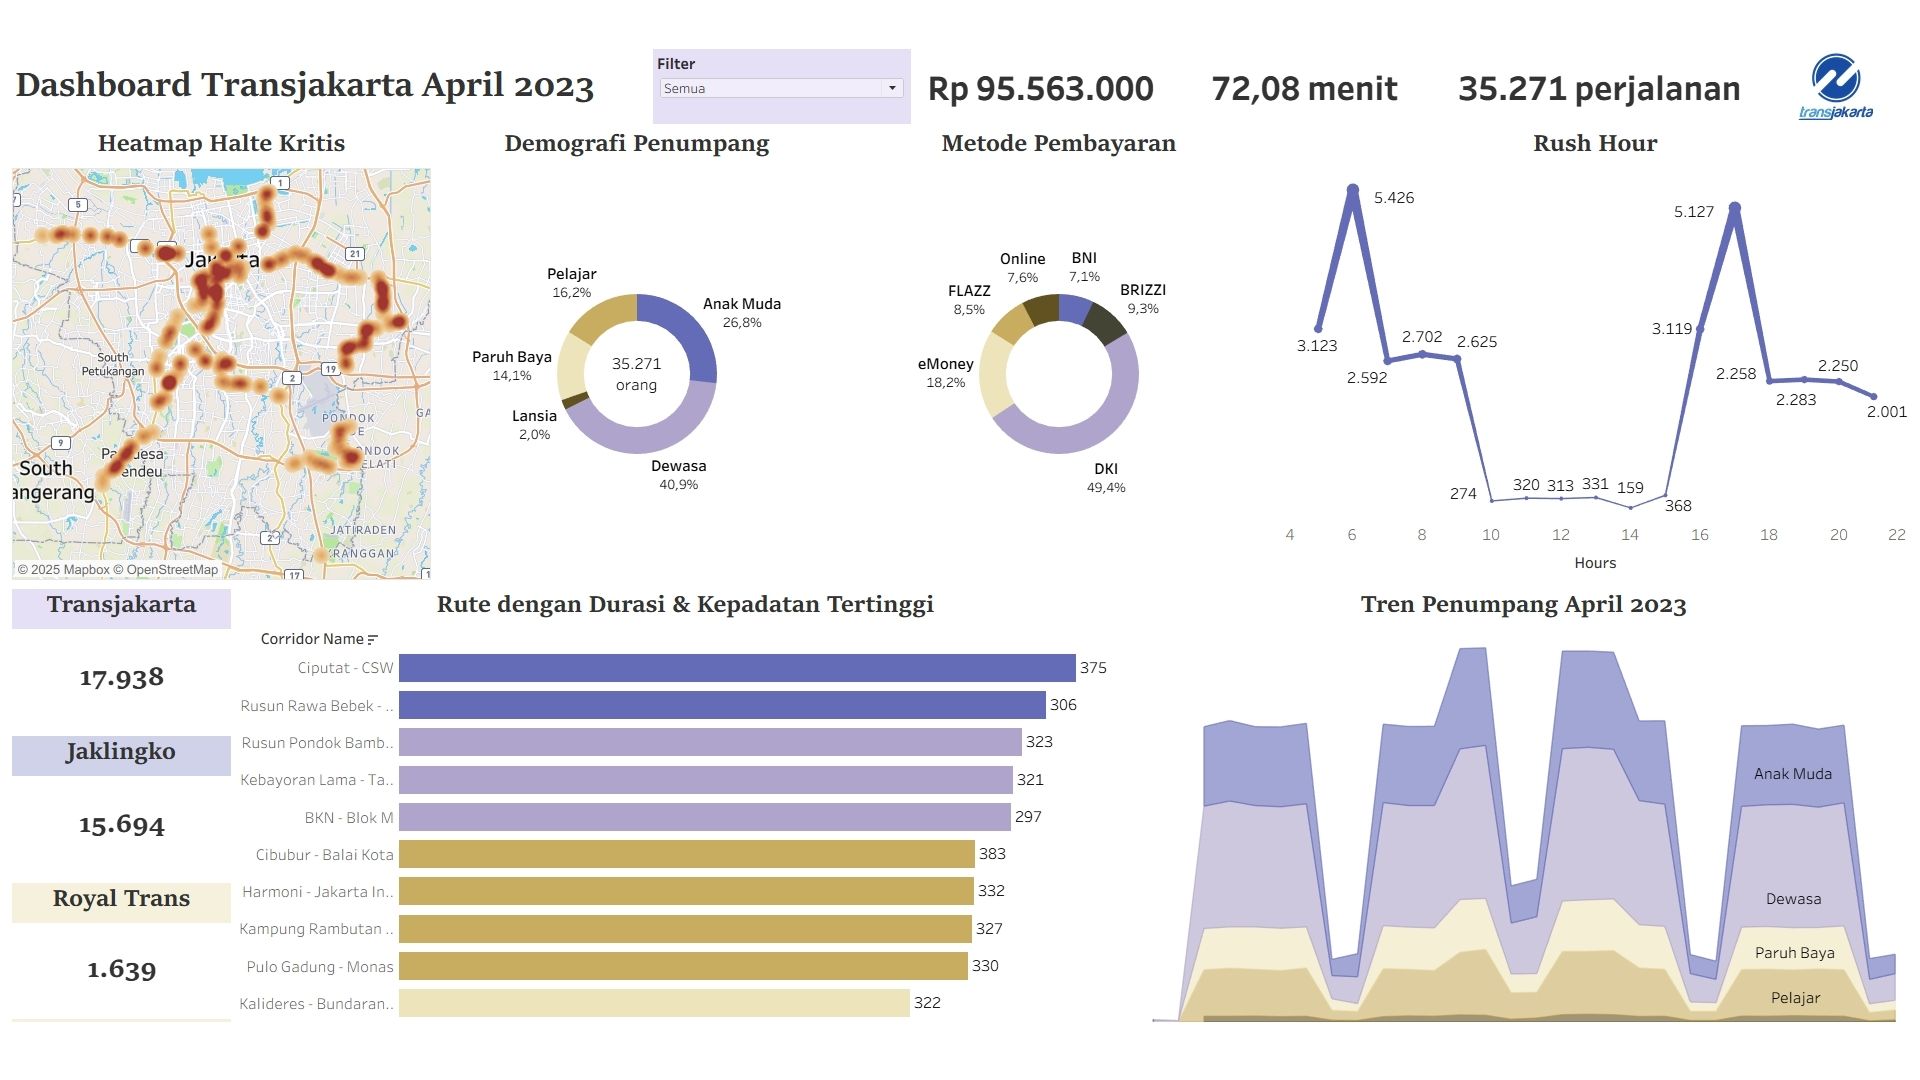
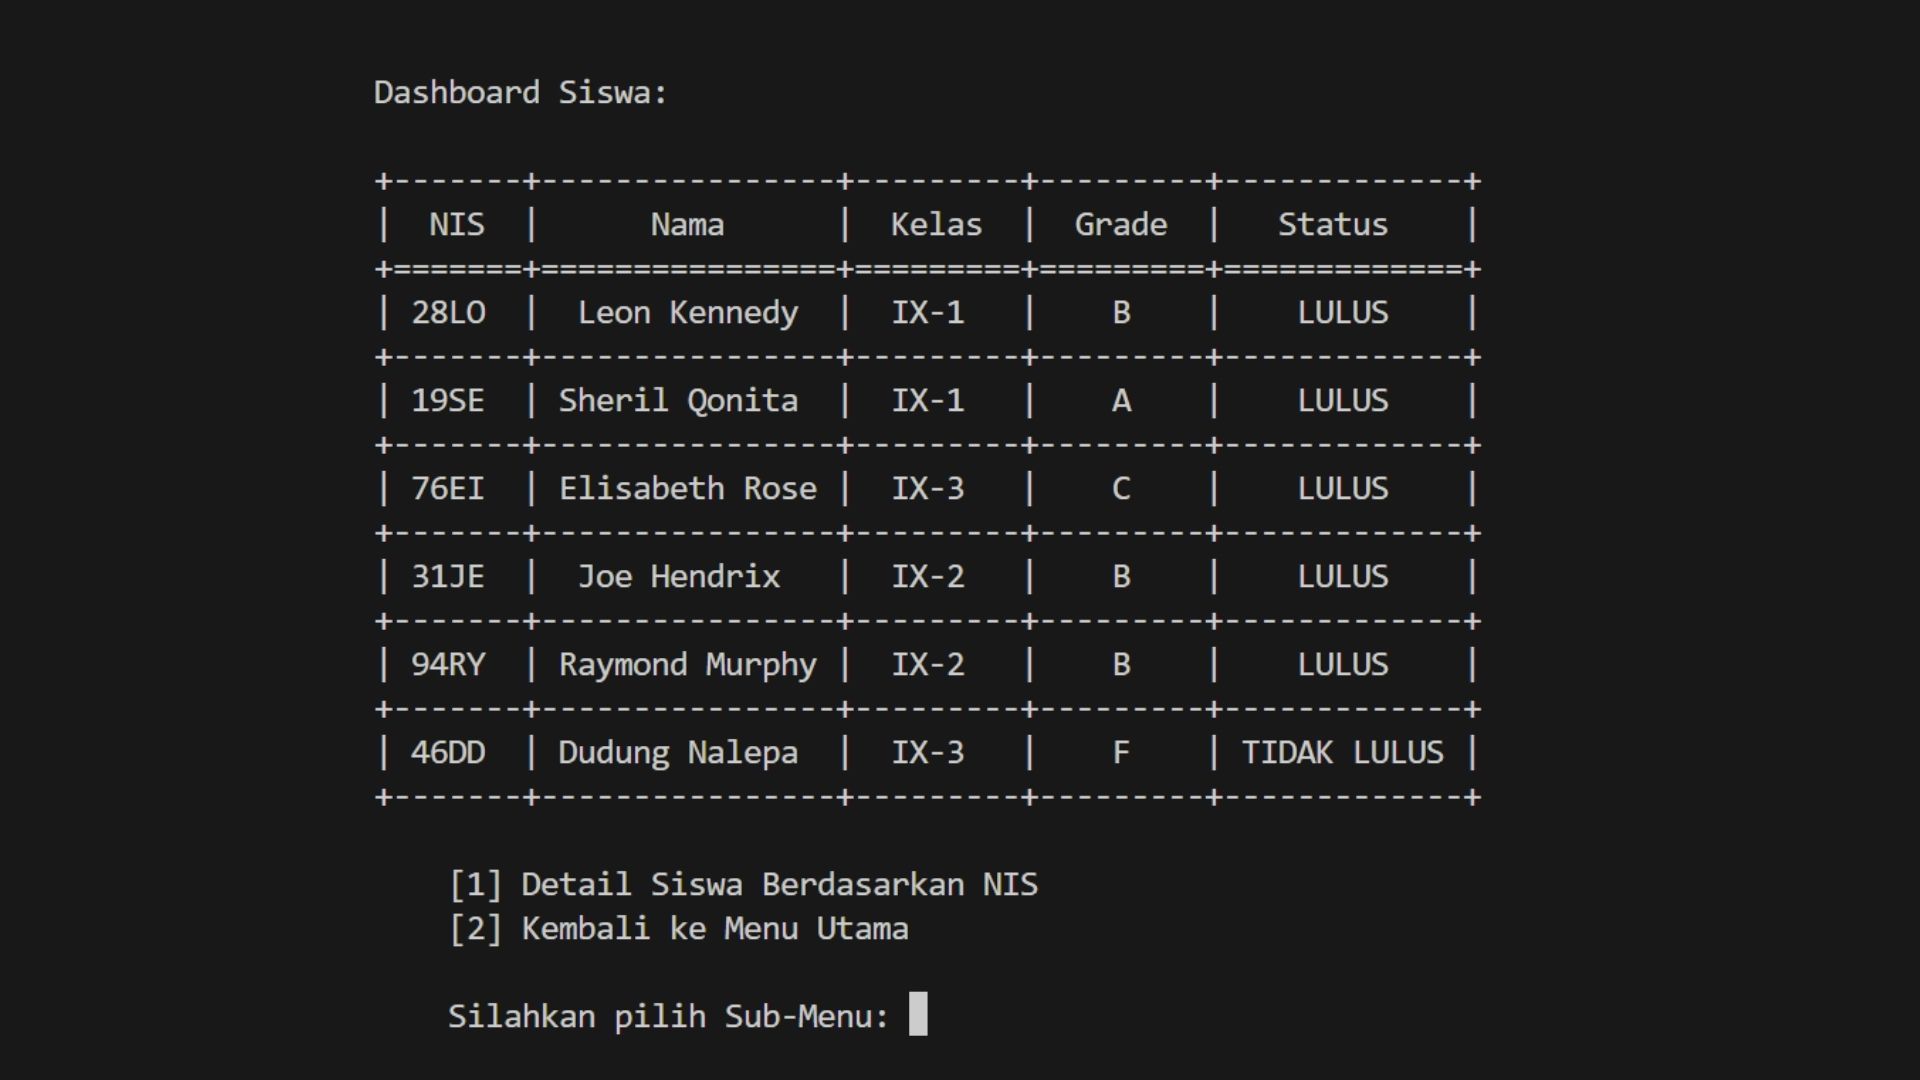
My portfolio covers churn prediction, NLP sentiment analysis, customer segmentation, and regression modeling, with deployments in Streamlit and dashboards in Tableau/Power BI. I work with Python, SQL, scikit-learn, XGBoost/CatBoost, and SHAP to turn data into actions teams can execute.
Built an end-to-end churn prediction system for 4,656 e-commerce customers using class-weighted XGBoost with train-only CV thresholding. Achieved F2=0.9677, AUC-PR=0.9948, Recall=0.9789 on a 1,126-customer holdout (TN=921, FP=15, FN=4, TP=186). Explained drivers with SHAP and deployed a Streamlit app plus an ROI-based retention playbook ($10,540 net impact simulation).
Built a sentiment triage model to classify negative (1–2) vs positive (4–5) Amazon reviews using TF-IDF (uni+bi-gram) + Multinomial Naive Bayes. Achieved 0.86 accuracy and F1_neg=0.86 with threshold tuning for operational trade-offs. At thr_pos=0.55, flagged ~1,100 reviews and estimated ~6 hours saved per 2,000 reviews (20 sec/review), surfacing key complaint themes (taste, packaging, delivery).
Built a housing price regression model on 14,448 districts using CatBoost, achieving MAE $27,533, MAPE 14.97%, and RMSLE 0.2113 (MAE improved by $3,223 vs Random Forest). Translated predictions into negotiation bands and an ROI decision rule, and deployed a Streamlit app for what-if pricing scenarios.
Segmented 5,869 customers from 541,910 transactions (UK retail, 2009–2011, £17.6M revenue) using LRFM features and K-Means (K=3; silhouette ~0.41). Quantified revenue concentration: top 1% customers generated 32.03% of revenue and the high-value cluster captured 85.96%, informing VIP retention and reactivation strategies.
Analyzed 37,900 TransJakarta trips (April 2023) to identify peak congestion windows and high-risk corridors. Found significantly higher travel times during 06:00–08:00 and 17:00–19:00 (Mann–Whitney U, p < 0.05) and surfaced longest routes averaging 81–84 minutes. Built a Tableau dashboard for route/time drilldowns to support fleet and headway optimization.
Developed a Python CLI system with validated CRUD, role-based access, and data-quality safeguards (input validation, soft delete, error handling). Added basic analytics (graduation rate, subject difficulty) and indexed search to improve usability and reporting.
Advanced proficiency in Python for data science, featuring expertise in Pandas, NumPy, Scikit-learn, and building scalable machine learning pipelines.
Creating compelling visual narratives using Tableau, Matplotlib, and Seaborn to transform complex data into actionable business insights.
Expert-level SQL skills for complex data extraction, transformation, and analysis using MySQL and Google BigQuery in enterprise environments.
Hands-on experience with supervised and unsupervised algorithms, focusing on model interpretability and solving real-world business challenges.
Main IDE for Python/SQL with extensions for linting, debugging, and notebooks.
Interactive environment for exploration, EDA, visualization, and ML experiments.
Business intelligence dashboards to communicate trends and KPIs to stakeholders.
Rapid data app prototyping and deployment directly from Python scripts.
Relational database for schema design, querying, and performance-minded ETL.
Cloud data warehouse for large-scale SQL analytics and ELT workflows.
Version control, issues, and collaboration for reproducible, reviewable projects.
Quick analysis, pivot tables, and handoff-friendly reports for business users.